Student Analytics Dashboards for Coaching Institutes in Kota

Credentials: Core engineering team specializing in enterprise architecture, Next.js, and cloud automation.
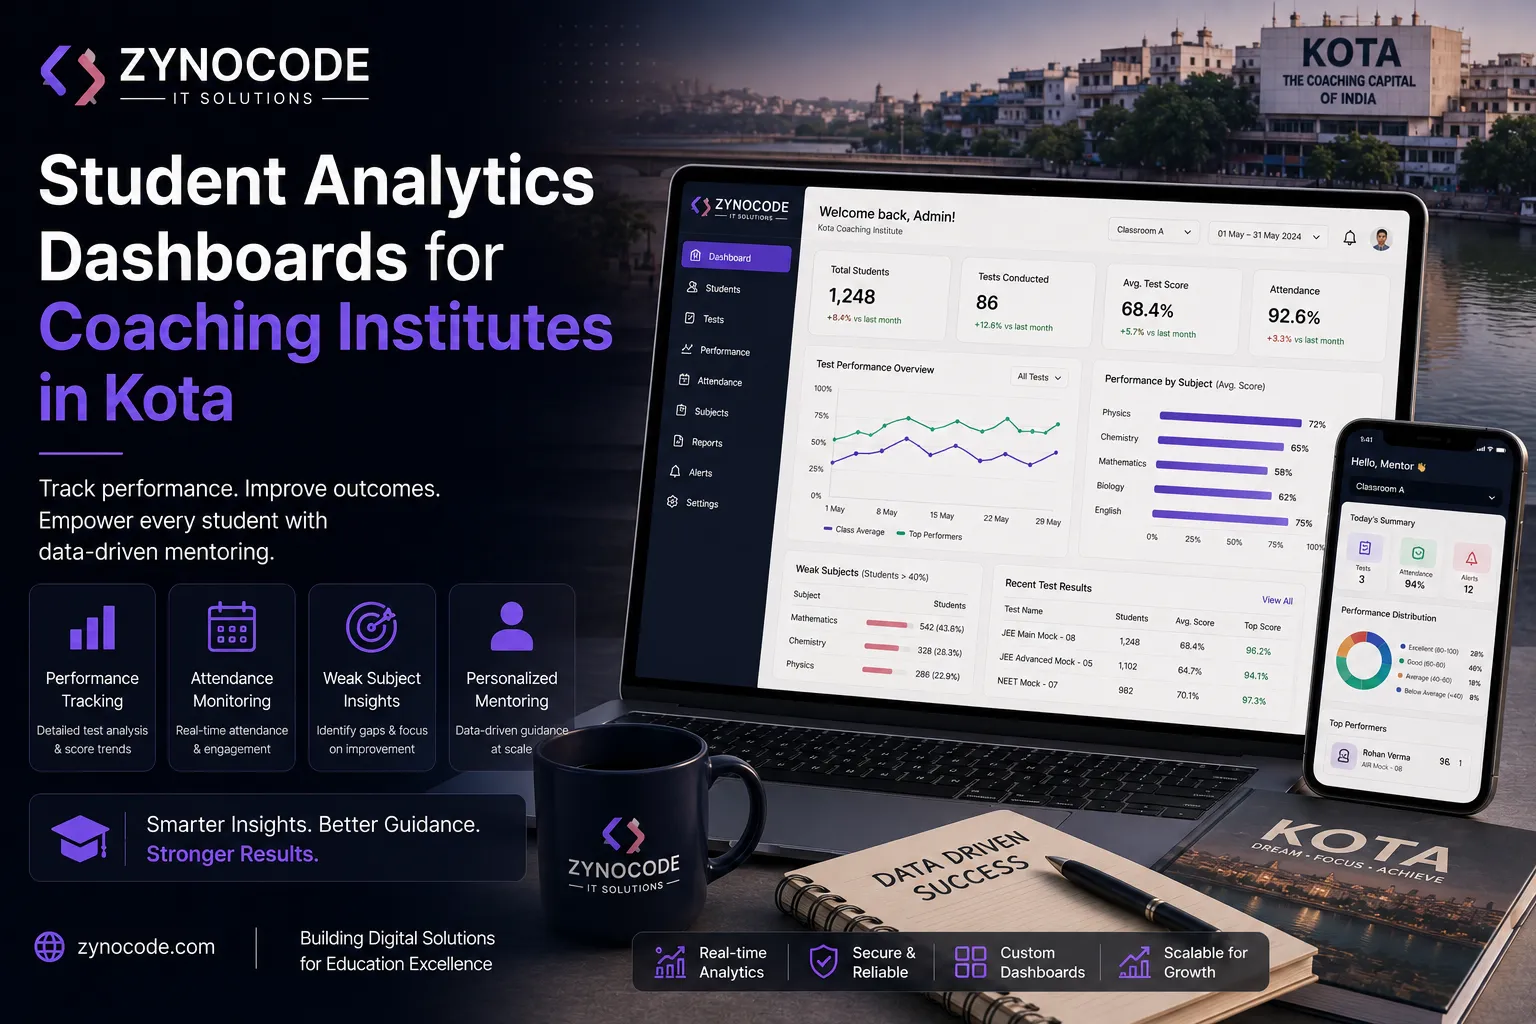
> TL;DR: Developing custom student analytics dashboards allows Kota coaching institutes to track individual test performance, attendance, and weak-subject metrics in real-time. By moving away from manual spreadsheets, educators can offer highly personalized mentoring at scale, directly improving student outcomes and institute rankings.
What Are Student Analytics Dashboards?
A student analytics dashboard is a centralized digital platform that aggregates academic performance data, attendance records, and engagement metrics into actionable visual reports for educators and students.
Why Data Visualization Matters in Kota
Kota’s coaching industry handles thousands of students per institute. Relying on manual data entry or basic spreadsheets leads to critical blind spots. High-performing students might slip in specific sub-topics, while struggling students may go unnoticed until the final exams.
Custom analytics dashboards solve this by:
- Visualizing progression trends across mock tests.
- Highlighting persistent weak areas down to the specific chapter or concept.
- Generating automated alerts when a student's attendance drops.
- Providing parents with transparent, real-time progress reports.
How Custom Analytics Dashboards Work
Building an effective dashboard requires integrating multiple data sources into a unified interface.
1. Data Ingestion & Integration The system pulls data from OMR sheet scanners, online test portals, and biometric attendance machines. This ensures all student interactions are logged without manual data entry.
2. Predictive Analytics & Trend Analysis Advanced platforms use machine learning algorithms to predict future performance based on historical test data, allowing teachers to intervene before major examinations.
3. Role-Based Access Control (RBAC) Custom systems provide distinct views: - **Management:** Institute-wide pass rates and faculty performance. - **Teachers:** Batch-level insights and individual student drill-downs. - **Students/Parents:** Personal progress trackers and comparative percentiles.
Practical Steps to Implementation
- 1Audit Existing Data: Identify where your current test scores and attendance records live (e.g., legacy ERPs, Excel files).
- 2Define Key Metrics: Determine exactly what metrics drive success (e.g., average time per physics question, mock test percentiles).
- 3Develop a Custom Solution: Partner with a software development agency to build a secure, cloud-hosted dashboard tailored to your institute's specific pedagogical approach.
- 4Train Faculty: Ensure teachers know how to interpret the dashboard data to adjust their lesson plans and mentoring sessions.
Common Mistakes to Avoid
- Information Overload: Displaying too many metrics on the main screen paralyzes decision-making. Keep the primary dashboard focused on critical KPIs.
- Ignoring Mobile Access: Parents and students expect to view progress on their phones. Ensure the dashboard is fully responsive or accompanied by a mobile app.
- Poor Data Security: Student data is highly sensitive. Failing to implement robust encryption and strict RBAC can lead to severe privacy breaches.
Conclusion
For coaching institutes in Kota, transitioning to custom student analytics dashboards is no longer optional—it is a competitive necessity. By transforming raw data into clear, actionable insights, institutes can provide the personalized attention required to produce top-ranking students year after year.
Related Zynocode Services Explore our [custom web applications](/services/web-applications-development) to see how we can build similar solutions for your business.
Further Reading If you found this useful, you may also want to read our article on [custom LMS software](/blog/custom-lms-software-coaching-institutes-kota).
<RelatedPosts targetPath="/india/kota" />
Dive deeper into our sibling spoke: EdTech App Development for Kota Coaching Centers ↗
Frequently Asked Questions

Written by Prashant
Engineering & Growth TeamWritten by a core engineering member at Zynocode, a leading custom software development company in Jaipur. Our team builds high-performance Next.js systems, mobile applications, and provides specialized expert generative engine optimization services for modern digital enterprises.
Related Services
Related Articles
EdTech App Development for Kota Coaching Centers
Read article →Custom SoftwareCustom LMS Software Development for Coaching Institutes in Kota
Read article →Custom SoftwareDigital Inventory Portals for Kishangarh Marble Factories
Read article →Web DesignCustom Web Design for Heritage Hotels in Ajmer & Pushkar
Read article →Free Tools from Zynocode Labs
100% in-browser • Zero server uploads • No account required
Client-Side Image Compressor
Compress WebP, PNG, and JPEG assets in-browser for 100/100 Core Web Vitals.
SVG Optimizer & Minifier
Clean unneeded XML attributes and minify SVG icons for fast web delivery.
JSON Formatter & Schema Validator
Format, validate, and inspect JSON-LD structured data and API responses.